Adding Multiple Matrices to Accolade Excel Reports
Reporting details can be contained in multiple sources within Accolade. To consolidate data into a single source to be used for reporting or the creation of charts or presentations, users can create reports to combine the data. Information from more than one project matrix can be pulled into a report by including a common value that is included in the sources, for example, using a Department or Region metric or a common Row ID.
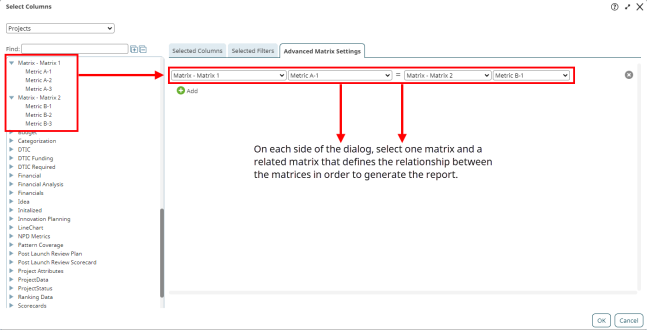
In addition to selecting the matrix and metric columns to be included in the report, users must create join statements that define how the matrix information is related.

To add multiple matrices to an Accolade Excel report:
- Create a new report or open an existing report for editing.
- On the Advanced Matrix Settings tab, select the matrices and metrics to be included in the report.
- Click
 Add to add the matrix join statements.
 - In each side of the dialog, select one of the matrices from the drop-down list, and select an option to use as the common value to join the matrices.
The two selected matrices must be different, but the matrix/metric combination can be any combination of metrics or row IDs, as long as the selected metrics share a common value and are of the same data type.
Selecting a metric will define it as the common value between the two matrices. Note that it can be the same metric if it is used in both matrices, or it can be different metrics that will have the same value in both matrices. In addition, a metric used as a common value does not need to be added as a reporting column in order to be used to create the join statement.
Selecting Row ID will compare matrices by rows, for example Row 1 in Matrix A will be compared with Row 1 in Matrix B, and so on. This can be used when there are no additional common values in the two matrices, and the matrices have a direct line-by-line comparison.
Caution! Selecting Row ID as a common value can cause inconsistencies in reporting. Since assigned Row IDs are not visible within a matrix, report results can be incorrect if rows have been deleted from a matrix or if there is a mismatch.

- Repeat steps 3-4 to add additional matrix join statements as necessary.
All included matrices must have at least one related join statement, but a matrix can be referenced in more than one statement. For example, if you choose to include metrics from Matrix A, Matrix B, and Matrix C, you would need to create two statements to join the information. You could create a statement that relates A to B, and one that relates B to C, or you could have a statement that relates A to B, and one that relates A to C.
- Finish setting up the report, as necessary.
- Click Done to apply your changes and generate the report.
Note: [EMPTY] or blank cells in your report may indicate a mismatch in the common value linking the matrices. If the project value referenced in the join statement is not defined in one of the matrices, for example if there is not a matching value in both matrices, or a matrix contains empty rows, the report will return partial or full rows that contain [EMPTY] values.
 Example
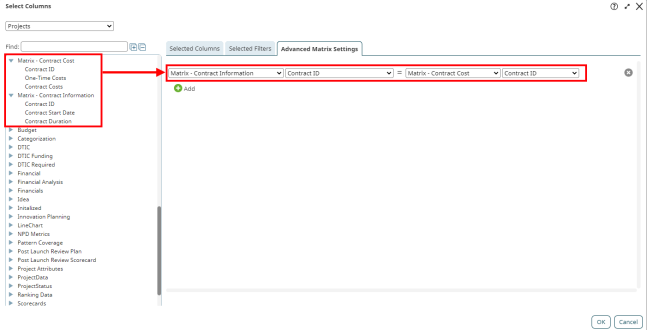
For example, a user has two different matrices that contain information related to vendor contracts for their projects, and needs to create a report containing relevant information from both matrices. They have a matrix named Contract Information, which contains the start date and duration of the specific contracts, and a second matrix named Contract Cost, which contains the costs related to the specific contracts.
To pull this information into one report, the user has added the related columns to the Columns tab, and created a join statement in the Advanced Matrix Settings tab that links the two matrices using the Contract ID metric that is a member of both matrices.

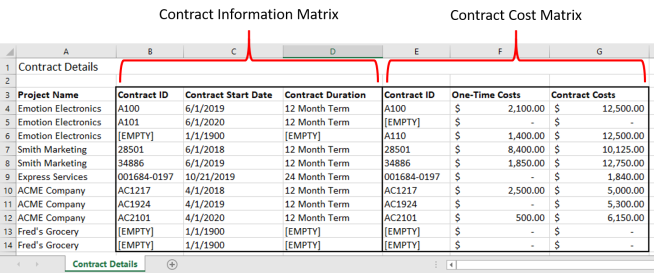
Once the user enters the remaining report details and clicks Done, the following report is generated.

Note the following:
The Contract ID field is the common identifier included in both matrices, and used to connect the relevant information.
Columns B-D contain information that is from the Contract Information matrix in the related projects.
Columns E-G contain information that is from the Contract Cost matrix in the related projects.
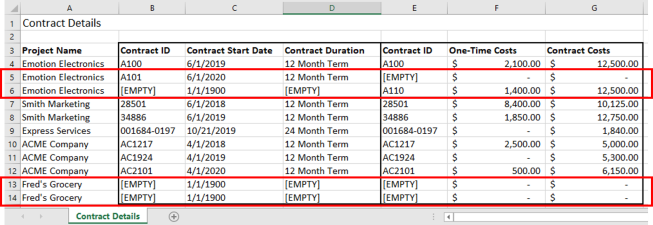
The highlighted sections below show two different scenarios that may indicate missing or incomplete data.
- Rows 5 & 6 of the report display [EMPTY] in some of the data cells, which indicates Contract IDs values that are not found in both matrices. In row 5, the information for contract A101 is only included in the Contract Information matrix, so the related Contract Cost matrix fields are [EMPTY]. In row 6, the information for contract A110 is only included in the Contract Cost matrix, so the related Contract Information matrix fields are [EMPTY].
- Rows 13 & 14 display [EMPTY] cells in all of the data cells, which indicates that one or more of the included matrices either does not have any rows added, or contains empty rows.
Note: Although the [EMPTY] returned values are an indicator of potential issues, the mismatched values reported are dependent on the data type. String and list metrics will display as [EMPTY]. As shown in the example below, a number metric will display 0, and a date metric will represent the default 1/1/1900 date.

|
Notes:
|
- Adding Calculated Columns to Accolade Excel Reports
- Adding Dynamic Filters to Accolade Excel Reports
- Adding Multiple Matrices to Accolade Excel Reports
- Creating Accolade Excel Reports using Accolade Office Extensions
- Refreshing Data in Accolade Excel Reports
- Updating Filters in Accolade Excel Reports
 in the corresponding definition row to delete it. Click