Gantt Views Overview
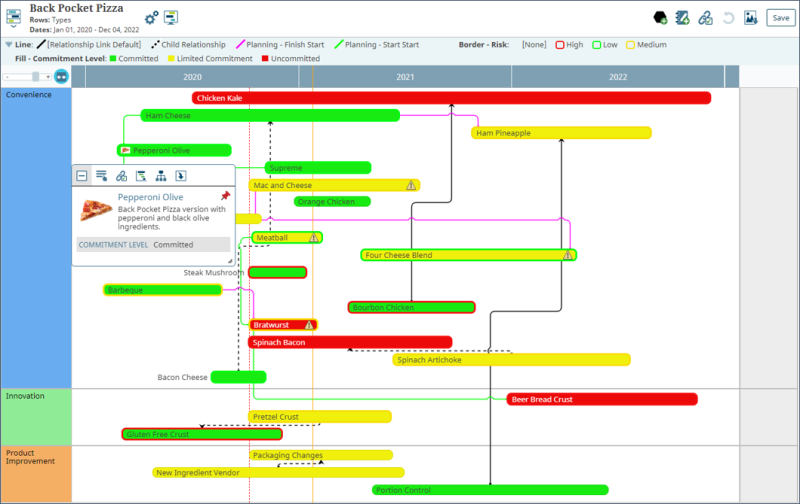
Available with Accolade Roadmapping, Gantt views can show relationships between elements across a span of time. They can focus the Planning view on a single point in time between multiple delivery plans to accomplish one large task, milestone, or product launch. For example, the design, production, and marketing efforts to launch a new product. The horizontal axis of the view represents is a timeline, while the vertical axis categorizes the elements by type or list metric, or by hierarchical relationship.

Create Gantt views that show elements color coded based on different metric values, generating a legend within the view. For example, as you are planning, you use a color coded list metric to indicate the opportunity level for each element in the plan. Within a Gantt view, you can display your elements with that color to visually see where your greatest opportunities are on the timeline.
Note: An individual single project can be viewed in a Gantt chart that shows its stages, gates, deliverables, and activities in a Gantt timeline by hovering over the element and clicking  to view the planning element's Time View.
See the following to get started:
- Creating Gantt Planning Views
- Working with Elements in Gantt Planning Views
- Modifying Gate Dates in Gantt Planning Views
- Using Element Legends in Planning Views
- Displaying Milestone and Gate Dates in Gantt Planning Views
- Displaying Phases in Gantt Planning Views