Using Element Legends in Planning Views
Color-coded legends offer a visual way to see values you have assigned to planning elements, while still being able to see the planning elements in a Grid or Gantt view. Using list metrics with defined colors, Planners can create planning views that show elements that are color-coded based on the element's metric value, generating a legend within the view.
In addition to shading an entire element, color legends can also be used to add identifying color borders to elements based on these same metric values, or to shade the phases within an element based on the value assigned to an element's phases.
 Example
As you are planning, you use two color-coded list metrics that are assigned to your planning element types:
- Risk - Indicates the completion risk for each element in your innovation plan. The list metric values include Low (color-coded green), Medium (color-coded yellow), and High (color-coded red).
- Opportunity - Indicates the opportunity level within the market for each element in your innovation plan. Your list metric values include Limited (color-coded blue), Neutral (color-coded purple), and Major Impact (color-coded red).
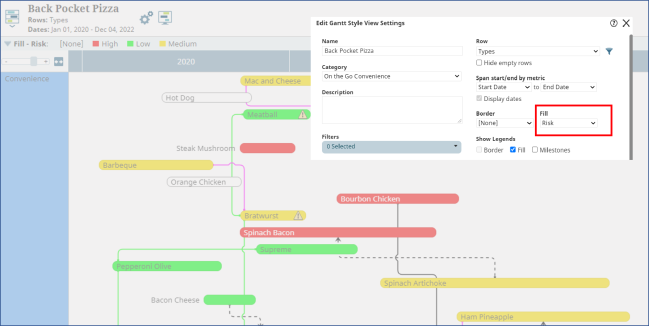
As you create your innovation plan, select the Risk and Opportunity level for each planning element. When you create a Gantt view, select to display the elements in the view color coded for Risk or for Opportunity.
The Fill selection displays the elements in the colors defined for the element type. Selecting the Risk list metric updates the elements in the Gantt to reflect the color of the assigned Risk value, and an interactive legend displays within the view that identifies what the element colors represent.

Note: Although the example represents elements legends as used in a Gantt view, they can be used in a similar fashion within Grid views.
To define element legends for use in planning views:
- From the Planning menu, select Planning Board.
- Add list metrics to planning elements and assign each list item a color.
Only list metrics with colors defined for one or more of their list items display as legend options, including metrics set as Available to Phases.
- Add planning elements to the Planning Board.
- Assign the list value for the list metrics available to that element type.
- Create a view or display a saved view.
- Select the list metric you want to use for one or both of the available fields:
- For Gantt views, make selections in the Border and/or Fill fields.
- For Grid views, make a selection in the Border field.
- (Optional) In the Show Legends section, select the Border and/or Fill check boxes to include interactive legend(s) within the view.
-
Click Create to display a new view, or Refresh View to apply the changes and refresh an existing view.
-
Click Save in the top right corner of the view to save your changes to the view.
Using Interactive Legends in Planning Views
When Fill and/or Border legends are used in planning views, they include an interactive legend that helps users identify what the colors in the view represent.
When the Milestones legend option is selected in a Gantt planning view, an interactive legend will display that indicates what the milestone shapes in the view represent. While the functionality of a milestone legend is the same, the icons all display in default black, regardless of the actual milestone colors displayed in the view.
Elements that display white either do not contain the list metric selected for the legend, or the assigned item list does not contain a color assignment. The [None] value displayed in the interactive legend is also an indication of these conditions
The following options can be used to modify all planning view legends:
- Click
 to expand or collapse the legends in the view as necessary.
 - Clicking on a legend item will hide the corresponding elements from the view, and the legend item will display with a strikethrough. Clicking on a strikethrough legend item will remove the strikethrough and display the corresponding elements.
|
Notes:
|
- Combining Gantt Views into Composite Views
- Creating Gantt Planning Views
- Displaying Gantt Views in Presentation Mode
- Displaying Milestone and Gate Dates in Gantt Planning Views
- Displaying Phases in Gantt Planning Views
- Displaying Relationships Between Planning Elements
- Highlighting Dates in Gantt Planning Views
- Modifying Gate Dates in Gantt Planning Views
- Pinning Element Details and Images
- Resolving Relationship Conflicts Between Planning Elements
- Using Element Legends in Planning Views
- Viewing Child Elements in Hierarchy Gantt Planning Views
- Working with Elements in Gantt Planning Views