Creating Project Portfolio Level Reports
Use metric and metadata filters to create a report with a portfolio view that pulls child linked project values and is viewable within the parent project. Create portfolio level reports that use the related system project ID relative metadata filter to roll up and view data across projects in a portfolio. Configured portfolio reports allow you to create charts that visually display data representing the related projects.
In the example of a portfolio below, Project A is linked to Project B - D by Child Relationship link types, where Project A is the parent. Create a report with relative metadata filters of related system project ID and related project link type name. These specific metadata filters allow the report to identify and dynamically capture child project data. View the report from within project A to garner a portfolio view of project B-D data. If the same report is viewed from within Project B, Project E and Project F data would display.

To create portfolio views in Accolade:
Note: The following procedure assumes a hierarchical portfolio structure with Child Relationship project link types. Adjust the filters according to link types to pull data from projects with different relationships.
- Create a new report or edit an existing report, ensuring the Override Project Filtering check box is selected on the report settings.
- Click
 in the upper right corner to view the report details, and click the Selected Filters section.
 - Select the Projects subject and expand the Project Related Projects group.
- Add the following filters to the report:
- Related Project System Project ID
- Related Project Link Type Name
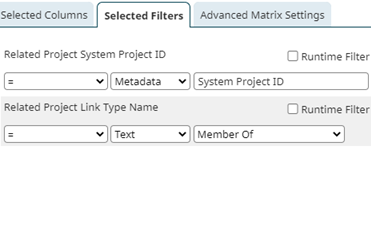
- For the Related Project System Project ID filter, select the equals (=) operator and Metadata from the associated drop-down. Enter System Project ID as the metadata value.
-
For the Related Project Link Type Name select the equals (=) operator and Text from the associated drop-down. Select Member of as the filter qualifier. More...

- Click OK to save the filter selections and return to the report settings.
Click  in the upper right corner to display a preview of the report contents prior to saving.
- Click Save to save the report.
- (Optional) Associate the report to a project via a layout or the project Reports page.
|
Notes: |
- Adding Dynamic Filters to Online Reports
- Adding Projects to Project Portfolios
- Creating Process Models for Portfolio Projects
- Creating Project Portfolio Level Reports
- Linking Related Projects
- Manage Project Portfolios Overview
- Managing Projects in Project Portfolios
- Navigating Project Portfolios
- Using Standard Process Models
- Viewing Relationships in Project Portfolios
 in the corresponding filter row to delete it. Click